Visualization for your heating network
For the visualization of heating networks we have developed a product for our customers which is composed of several modules. Thereby we always paid attention to the compliance of safety standards. In addition to the extensive range of functions, user-friendliness is a major concern for us. Our visualization is therefore divided into the following modules: e-Central, Viewer, Informer, James, Evaluator, e-View, Smart, Caloris. As server solutions we offer our customers basically three approaches: BASIC, PRO and SERVER
aqo360° Visualization software
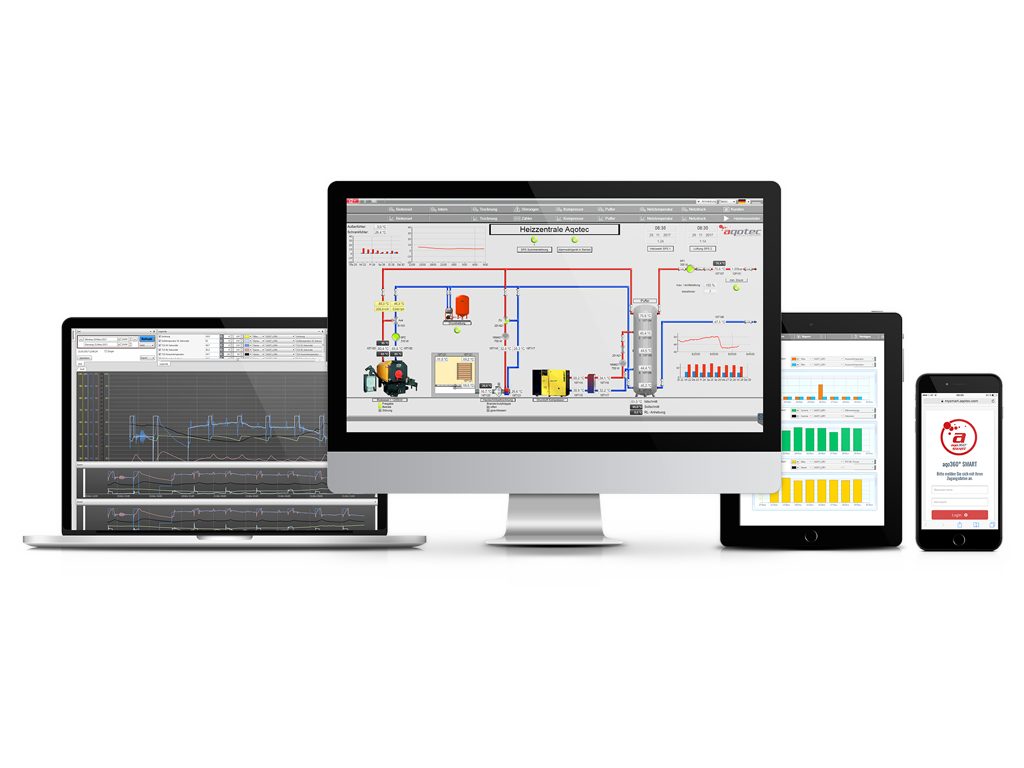
The data acquisition and visualisation program is used to display all the values acquired from the district heating system. All connected control devices of the transfer stations are displayed in the MS-Windows interface in separate windows and tables. In principle, it is possible for the customer to edit the entire representation of the plant according to his own ideas. The system visualisation and the integrated overall control starts with the energy production in the heating system. The targeted and optimal use of energy sources, the distribution of heat energy into the grid, the control of the house transfer stations, the secondary side control circuits, the leakage warning monitoring up to the consumption billing. All processes can be documented transparently. The operating data of the individual plant sections are continuously logged and are then available for dynamic evaluations.
MODULS
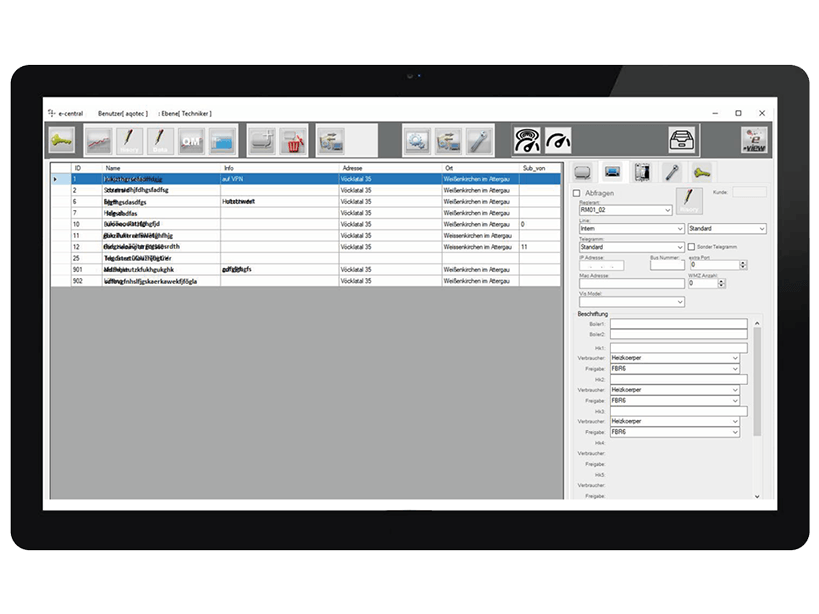
e-Central
In e-central, new customers are created and master data for the systems is managed. Communication and logging are generated automatically.
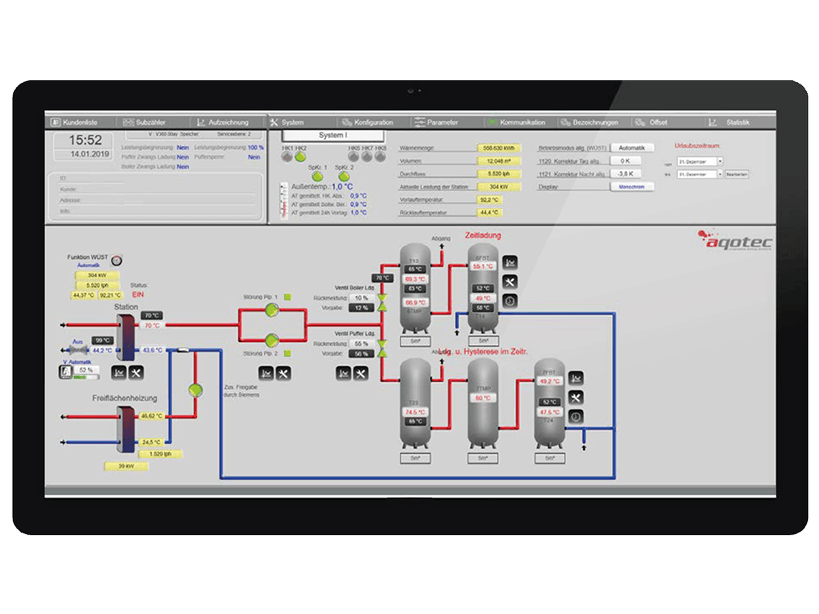
Viewer
In the viewer, the assets and recipients are displayed with all live data. All plant parameters can be adjusted using this interface. The user interface adapts itself automatically based on the control configuration.
Informer
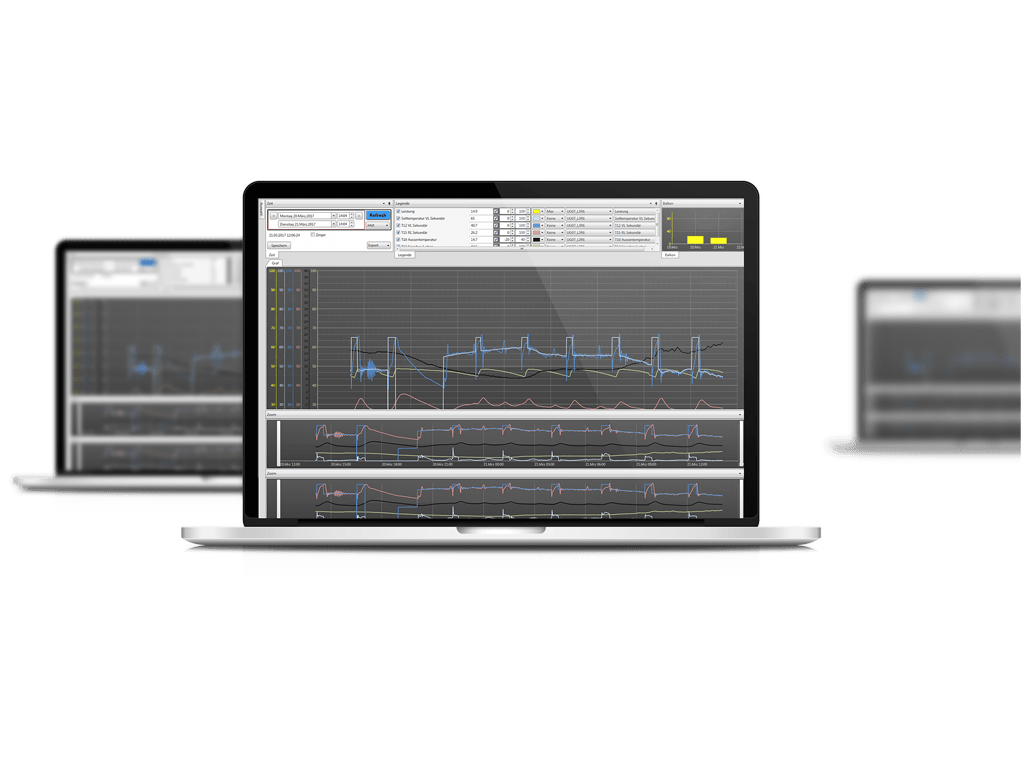
After selecting the time range and the desired display values in the legend, they are displayed as a graph or bar chart.
James
James - the virtual heating engineer - takes over the daily checks of the plants. If deviations occur, James points them out immediately. Furthermore, James can automatically generate customer-specific reports and reports at adjustable intervals.

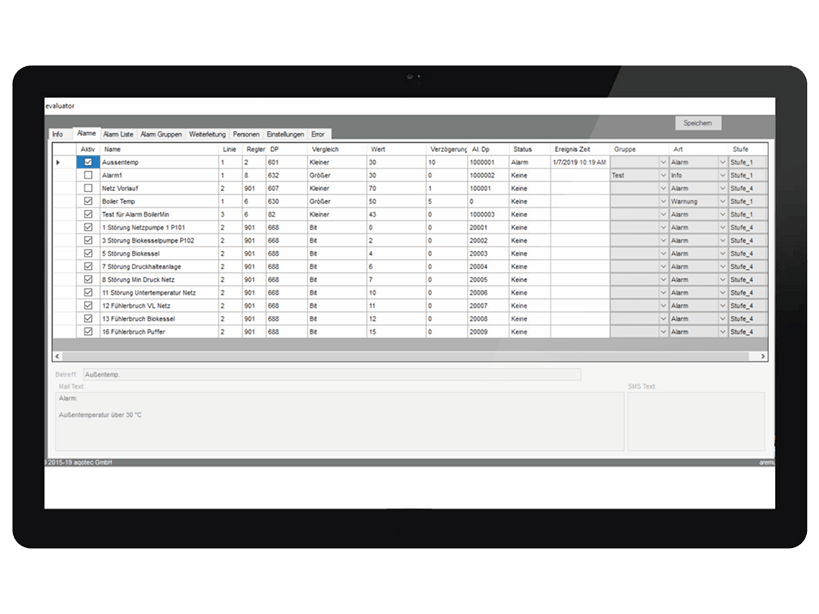
Evaluator
In the evaluator, it is possible to send reports automatically via mail, after previously defined time intervals. Furthermore, alarms can be managed and generated. These are sent via e-mail or SMS by an external provider.
e-view
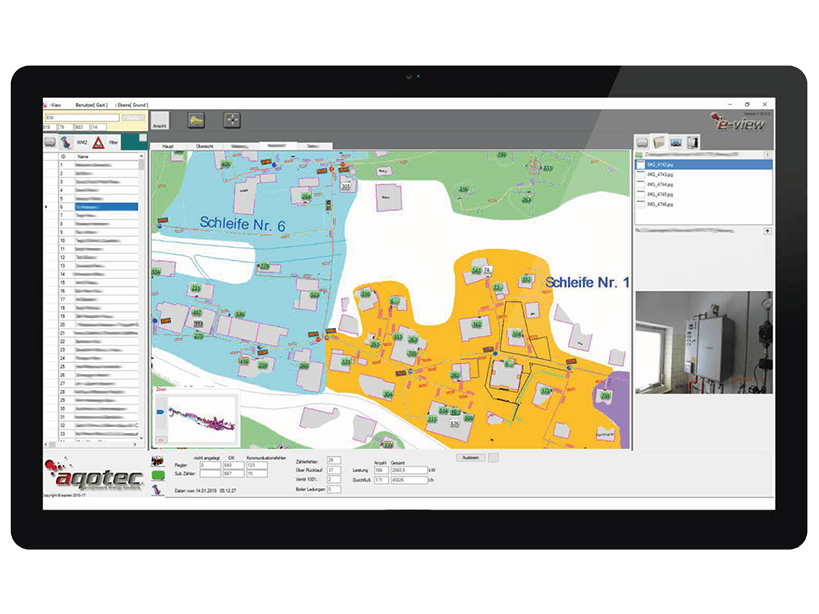
e-view is an extension tool of the visualization software and serves, among other things, to optimize operating procedures in the network.
SMART
The Smart expansion module is indispensable, especially in today's world. The visualization can also be called up by this module via mobile devices (smartphone, tablet).
FUNCTIONS
Management-Console
With the innovative management console, comprehensive processes in the network can be configured and initiated event- or time-controlled. Various management processes can be used to influence the loading and unloading behavior of individual consumers or entire consumer groups simultaneously.
Power limitation
Load shedding
Boiler Management
Buffer Management
x-Archiv
x-Archive displays historical parameters of each individual controller in the heating network in the form of a graphic visualization. This allows current values and historical values to be compared and contrasted.

